Hello everyone!
I am Davinder Partola. I will be doing the post for today which will be basically on Introducing graphing polynomial functions since my friends pretty much covered everyhting else we did in their posts.
Basically we are Covering degrees up to 5 in our precal class.which are:
0= constant , 1= Linear , 2= Quaderatic, 3= Cubic, 4= Quartic and 5 = Quintic
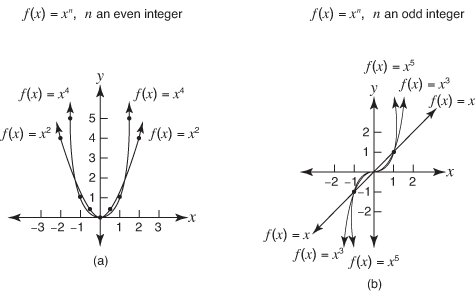
When you're graphing (or looking at a graph of) polynomials, it can help to already have an idea of what basic polynomial shapes look like.
Steps involved in graphing polynomial functions:
- Predict the end behavior of the function.
- Find the real zeros of the function. Check whether it is possible to rewrite the function in factored form to find the zeros. Otherwise, use Descartes rule of signs to identify the possible number of real zeros.
- Make a table of values to find several points.
- Plot the points and draw a smooth continuous curve to connect the points.
- Make sure that the graph follows the end behavior as found in the above step.
One of the aspects of this is "end behavior", and it's pretty easy.
Main aspects to remember are:
odd degrees if positive: expands from quadarant 3 to quaderant 1
if negitive: expands from quaderant 4 to 2
even degrees if positive: expands from quaderant 2 to 1
if negitive: expands from quaderant 3 to 4

The y intercept is when x = 0. Also where the line drawn touches the graph on y axis
The x intercept is when y = 0."x-intercepts" = "roots" = "solutions" = "zeroes"
For this example the x intercept would be -5,2,4
Example:
Graph the polynomial function x3 – 2x2 – 3x . Predict the end behavior of the function.
The degree of the polynomial function is odd and the leading coefficient is positive.

The degree of the polynomial is 3 and there would be 3 zeros for the functions.
The function can be factored as x ( x + 1)( x – 3). So, the zeros of the functions are x = –1, 0 and 3.
Make a table of values to find several points.

Plot the points and draw a smooth continuous curve to connect the points

I wish this kind of helped you learning some concepts. But if you still dont get it: PRACTICE Because practice makes everyone perfect.
sources:
http://hotmath.com/hotmath_help/topics/graphing-polynomial-functions.html
and
My brain (Oh Yeah)

No comments:
Post a Comment