Alyza Umali, at your service!
Today, i will be reviewing the characteristics of a given polynomial function. This took me about 30 minutes to do, but it was worth it! I felt as though constructing this blog will help me understand the lesson more by trying to teach it to someone else :)
First off, lets review what we know:
Degree
- It is known as the highest degree of its terms, meaning the highest x power (eg. x8)
ex) f(x)=x8 + 6x7 +4x2
=> The highest degree is 8, therefore known as an "eighth degree polynomial"
Leading Coefficient
- The coefficient with the highest degree in the term.
- y = -2x3 + 6x- 4 (Negative = -2)
- y = 3x3- 4x2 -5x +2 (Positive = 3)
Naming Functions
Constant Function
No x-intercept
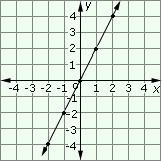
Linear Function
1 x-intercept
Quadratic Function
2 x-intercepts
Cubic Function
3 x-intercepts
Quartic Function4 x-intercepts
Quintic Function
5 x-intercepts
- The quadrants in where the polynomial starts and ends.
Quadrant I = + X & +Y
Quadrant II = -X & +Y
Quadrant III = -X & -Y
Quadrant IV = +X & -Y
ex) Rules in Graphing Polynomials:
EVEN Degree Polynomials
Positive Leading Coefficient
(eg. x2) Open upward

Negative Leading Coefficient
(eg. -2x2) Open downward
ODD Degree Polynomials
Positive Leading Coefficient
Starts/Ends Quadrant II & IV

Negative Leading Coefficent
Starts/Ends Quadrant I & III

X-intercepts (Zeros)
- The points on a graph in where the function crosses the x-axis.
ex) y = (x+2)(x+1)(x-1)(x-2)
Your x-intercepts would be: -2, -1, 1, & 2.
* NOTE -
Unique Roots - Curve crosses x-axis 1 time !
Same Roots - This is also known as the Multiplicity of a Zero
- Even # of roots - Bounces off the x-axis!
- Odd # of roots - Becomes flatter!
ex) The graph shows an even root that is a "Multiplicity of 2 at -4"
ex) The graph shows an odd root that is a "Multiplicity of 3 at -3"
Relative Minimum/Maximum
- Cubic Functions have neither a minimum or maximum, but they DO have a RELATIVE minimum or RELATIVE maximum.
Absolute Minimum/Maximum
- Quartic functions can have both relative and absolute minimum and maximum.
Determining Intervals when function is Positive or Negative.
- Parts of the function that are below the x-axis are negative, and the other parts of the function that cross over the x-axis are positive.
Now to ponder!
When looking at a polynomial equation and you must draw a function on a graph, first thing is to ask
yourself:
- What is the Degree?
- Is the sign of the Leading Coefficient Positive? or Negative?
- Where does my end behaviour start and end?
- What is/are my x-intercept(s)?
- What is my y-intercept?
- Does it have any unique or same roots? If so, Odd? or Even?
Always read the question carefully and BE CONFIDENT IN YOUR ANSWER!
Now that you have an idea of most of the characteristics and rules for a polynomial function, you are now able to analyze majority of any polynomial function and be able to graph it! Good luck this semester everyone! God Bless! (:


No comments:
Post a Comment