Hello everyone,
Rowell here and I guess its my turn to blog but I don't think I can make a long blog so here are some links that should help,
(click the text)
Graphs of Polynomial Functions
Multiplicity and Zeros
Analyzing Graphs of Polynomial Functions
hope this somewhat helps..
Rowell
Wednesday, March 27, 2013
Wednesday, March 20, 2013
Characteristics of YOUR Polynomial Function!
Alyza Umali, at your service!
Today, i will be reviewing the characteristics of a given polynomial function. This took me about 30 minutes to do, but it was worth it! I felt as though constructing this blog will help me understand the lesson more by trying to teach it to someone else :)
First off, lets review what we know:
Degree
- It is known as the highest degree of its terms, meaning the highest x power (eg. x8)
ex) f(x)=x8 + 6x7 +4x2
=> The highest degree is 8, therefore known as an "eighth degree polynomial"
Leading Coefficient
- The coefficient with the highest degree in the term.
- y = -2x3 + 6x- 4 (Negative = -2)
- y = 3x3- 4x2 -5x +2 (Positive = 3)
Naming Functions
Constant Function
No x-intercept
Linear Function

1 x-intercept
2 x-intercepts

Cubic Function
3 x-intercepts

4 x-intercepts

5 x-intercepts

- The quadrants in where the polynomial starts and ends.

Quadrant II = -X & +Y
Quadrant III = -X & -Y
Quadrant IV = +X & -Y
ex) Rules in Graphing Polynomials:
EVEN Degree Polynomials
Positive Leading Coefficient
(eg. x2) Open upward

Negative Leading Coefficient
(eg. -2x2) Open downward

ODD Degree Polynomials
Positive Leading Coefficient
Starts/Ends Quadrant II & IV

Negative Leading Coefficent
Starts/Ends Quadrant I & III
X-intercepts (Zeros)
- The points on a graph in where the function crosses the x-axis.
ex) y = (x+2)(x+1)(x-1)(x-2)
Your x-intercepts would be: -2, -1, 1, & 2.
* NOTE -
Unique Roots - Curve crosses x-axis 1 time !
Same Roots - This is also known as the Multiplicity of a Zero
- Even # of roots - Bounces off the x-axis!
- Odd # of roots - Becomes flatter!
ex) The graph shows an even root that is a "Multiplicity of 2 at -4"

ex) The graph shows an odd root that is a "Multiplicity of 3 at -3"

Relative Minimum/Maximum
- Cubic Functions have neither a minimum or maximum, but they DO have a RELATIVE minimum or RELATIVE maximum.

Absolute Minimum/Maximum
- Quartic functions can have both relative and absolute minimum and maximum.
Determining Intervals when function is Positive or Negative.
- Parts of the function that are below the x-axis are negative, and the other parts of the function that cross over the x-axis are positive.

Now to ponder!
When looking at a polynomial equation and you must draw a function on a graph, first thing is to ask
yourself:
- What is the Degree?
- Is the sign of the Leading Coefficient Positive? or Negative?
- Where does my end behaviour start and end?
- What is/are my x-intercept(s)?
- What is my y-intercept?
- Does it have any unique or same roots? If so, Odd? or Even?
Always read the question carefully and BE CONFIDENT IN YOUR ANSWER!
Now that you have an idea of most of the characteristics and rules for a polynomial function, you are now able to analyze majority of any polynomial function and be able to graph it! Good luck this semester everyone! God Bless! (:
Monday, March 18, 2013
Graphing Polynomial functions
Hello everyone!
I am Davinder Partola. I will be doing the post for today which will be basically on Introducing graphing polynomial functions since my friends pretty much covered everyhting else we did in their posts.
Basically we are Covering degrees up to 5 in our precal class.which are:
0= constant , 1= Linear , 2= Quaderatic, 3= Cubic, 4= Quartic and 5 = Quintic
When you're graphing (or looking at a graph of) polynomials, it can help to already have an idea of what basic polynomial shapes look like.
Steps involved in graphing polynomial functions:
- Predict the end behavior of the function.
- Find the real zeros of the function. Check whether it is possible to rewrite the function in factored form to find the zeros. Otherwise, use Descartes rule of signs to identify the possible number of real zeros.
- Make a table of values to find several points.
- Plot the points and draw a smooth continuous curve to connect the points.
- Make sure that the graph follows the end behavior as found in the above step.
One of the aspects of this is "end behavior", and it's pretty easy.
Main aspects to remember are:
odd degrees if positive: expands from quadarant 3 to quaderant 1
if negitive: expands from quaderant 4 to 2
even degrees if positive: expands from quaderant 2 to 1
if negitive: expands from quaderant 3 to 4

The y intercept is when x = 0. Also where the line drawn touches the graph on y axis
The x intercept is when y = 0."x-intercepts" = "roots" = "solutions" = "zeroes"

Example:
Graph the polynomial function x3 – 2x2 – 3x . Predict the end behavior of the function.
The degree of the polynomial function is odd and the leading coefficient is positive.

The degree of the polynomial is 3 and there would be 3 zeros for the functions.
The function can be factored as x ( x + 1)( x – 3). So, the zeros of the functions are x = –1, 0 and 3.
Make a table of values to find several points.

Plot the points and draw a smooth continuous curve to connect the points

I wish this kind of helped you learning some concepts. But if you still dont get it: PRACTICE Because practice makes everyone perfect.
sources:
http://hotmath.com/hotmath_help/topics/graphing-polynomial-functions.html
and
My brain (Oh Yeah)
Sunday, March 17, 2013
Remainder theorem, Factor theorem, and Rational root theorem
Hi everyone, it's Amina and this blog is about our lesson on remainder theorem, factor theorem, and rational root theorem.
Remainder Theorem:
The Remainder Theorem is useful for evaluating polynomials at a given value of x.
The Remainder Theorem starts with an unnamed polynomial p(x), where "p(x)" that means "some polynomial p whose variable is x". Then dividing that polynomial by a linear factor x – a, where a is just some number. As a result of the synthetic division, you end up with some polynomial answer q(x) (the "q" standing for "the quotient polynomial") and some polynomial remainder r(x).
Example:
p(x) = x3 – 7x – 6 and divide be x-4( so a =4)
We get a quotient of q(x) = x2 + 4x + 9 , with a remainder of r(x) = 30.
If p(x) / (x – a) = q(x) with remainder r(x),
then p(x) = (x – a) q(x) + r(x).
Since (x^3 – 7x – 6) / (x – 4) = x2 + 4x + 9 with remainder 30,
then x3 – 7x – 6 = (x – 4) (x2 + 4x + 9) + 30.
Another way to get the remainder is we replace x with 4.
p(4) = (4 – 4)((4)2 + 4(4) + 9) + 30 = (0)(16 + 16 + 9) + 30 = 0 + 30 = 30
Factor Theorem:
The factor theorem is a theorem commonly applied to factorizing and finding the roots of polynomial equations. If P(x), a polynomial in x is divided by x - a and the remainder is zero, then (x - a) is a factor of P(x)
Example:
Is x - 2 is a factor of x2 - 7x + 10.
Let P(x) = x2 - 7x + 10
By the factor theorem, x - 2 is the factor of P(x) if P(2) = 0.
P(x) = x2 - 7x + 10
P(2) = 22 - 7 * 2 + 10 (Substitute x = 2)
= 4 - 14 + 10
= 0
Since P(2) = 0 => x - 2 is a factor of P(x).
Rational Root Theorem:
Steps to solving rational root theorem questions:
 for which
P() = 0
. These are all the rational roots of
P(x)
.
for which
P() = 0
. These are all the rational roots of
P(x)
.
Example:
Thus, the rational roots of
P(x)
are
x = - 3
,
-1
,
 , and
3
.
, and
3
.
Sources:
http://www.purplemath.com/modules/remaindr.htm
http://math.tutorvista.com/algebra/factor-theorem.html
http://www.sparknotes.com/math/algebra2/polynomials/section4.rhtml
Remainder Theorem:
The Remainder Theorem is useful for evaluating polynomials at a given value of x.
The Remainder Theorem starts with an unnamed polynomial p(x), where "p(x)" that means "some polynomial p whose variable is x". Then dividing that polynomial by a linear factor x – a, where a is just some number. As a result of the synthetic division, you end up with some polynomial answer q(x) (the "q" standing for "the quotient polynomial") and some polynomial remainder r(x).
Example:
p(x) = x3 – 7x – 6 and divide be x-4( so a =4)
We get a quotient of q(x) = x2 + 4x + 9 , with a remainder of r(x) = 30.
If p(x) / (x – a) = q(x) with remainder r(x),
then p(x) = (x – a) q(x) + r(x).
Since (x^3 – 7x – 6) / (x – 4) = x2 + 4x + 9 with remainder 30,
then x3 – 7x – 6 = (x – 4) (x2 + 4x + 9) + 30.
Another way to get the remainder is we replace x with 4.
p(4) = (4 – 4)((4)2 + 4(4) + 9) + 30 = (0)(16 + 16 + 9) + 30 = 0 + 30 = 30
Factor Theorem:
The factor theorem is a theorem commonly applied to factorizing and finding the roots of polynomial equations. If P(x), a polynomial in x is divided by x - a and the remainder is zero, then (x - a) is a factor of P(x)
Example:
Is x - 2 is a factor of x2 - 7x + 10.
Let P(x) = x2 - 7x + 10
By the factor theorem, x - 2 is the factor of P(x) if P(2) = 0.
P(x) = x2 - 7x + 10
P(2) = 22 - 7 * 2 + 10 (Substitute x = 2)
= 4 - 14 + 10
= 0
Since P(2) = 0 => x - 2 is a factor of P(x).
Rational Root Theorem:
Steps to solving rational root theorem questions:
- Arrange the polynomial in descending order
- Write down all the factors of the constant term. These are all the possible values of p .
- Write down all the factors of the leading coefficient. These are all the possible values of q .
- Write down all the possible values of
. Remember that since
factors can be negative,
and
-
must both be included.
Simplify each value and cross out any duplicates.
for which
P() = 0
. These are all the rational roots of
P(x)
. Example:
- P(x) = 2x 4 + x 3 -19x 2 - 9x + 9
- Factors of constant term: ±1 , ±3 , ±9 .
- Factors of leading coefficient: ±1 , ±2 .
- Possible values of
:
±
 ,
±
,
±
,
±
,
± ,
±
,
± ,
±
,
± ,
±
,
± .
These can be simplified to:
±1
,
±
,
±3
,
±
,
±9
,
±
.
.
These can be simplified to:
±1
,
±
,
±3
,
±
,
±9
,
±
.
- Use synthetic division:
, and
3
.Sources:
http://www.purplemath.com/modules/remaindr.htm
http://math.tutorvista.com/algebra/factor-theorem.html
http://www.sparknotes.com/math/algebra2/polynomials/section4.rhtml
Wednesday, March 13, 2013
Long Division, Synthetic Division, Remainder Theorem, and all that cool stuff!
Hello! This is Jan, what a cool name huh?
Well anyways everyone wrote a lot in the past posts, except for Keegan, and I don't think I could write a lot. As you can see creativity just bursts out of me. =)
Having trouble with polynomial division? CLICK HERE
Having trouble with synthetic division? CLICK HERE
And you just don't understand the remainder theorem? CLICK HERE
I don't know if that video explained that well enough for you but you can just google it or ask Mr. P! =)
Clearly I spent a lot of time on this so you guys should be thankful! And I had other homework too so you should be double thankful!
-Jan
Wednesday, March 6, 2013
The Inverse videos
Hey everybody, its Keegan Blogging today
I saw that every one just wrote a bunch of stuff with demonstrations so i thought id change it up a bit and find a video that explains how to do inverse function, because those are kind of tricky.
http://www.youtube.com/watch?v=35bFY0qRlhc
And another tricky thing is determining if two functions are inverse to each other algebraically, this video explains that
http://www.youtube.com/watch?v=auQdlFkI3xw
Keegan
Monday, March 4, 2013
Writing the Equation of a Transformed Function Graph / Inverse of a Relation and Function
Hi guys!
This is Adam and I am going to be your scribe for today.
First, I am going to show you how to write the equation of a transformed function graph.
Here's an example:

=%3E(4,4))
=%3E(0,0))
=%3E(-4,4))


)
=%3E(32,5))
=%3E(28,1))
=%3E(24,5))
=%3E(32,5)=%3E(4,4))
=%3E(28,1)=%3E(0,0))
=%3E(24,5)=%3E(-4,4))
=%3E(4,4))
]-1)


=5y)


=\frac{3}{5}x-\frac{6}{5})


,%20(1,-1),%20(2,0),(1,-3),(4,-4))
,%20(-1,1),%20(0,2),(-1,3),(-4,4))


This is Adam and I am going to be your scribe for today.
First, I am going to show you how to write the equation of a transformed function graph.
Here's an example:

We are given a function f(x) and its transformation g(x), and we have to determine g(x)'s equation in the form ]+k) .
.
First, we write down the corresponding coordinates of each function.
For now, we'll just leave this alone for the time being.
We have to figure out the stretches/compressions before we figure the translations so we start with our a (vertical) and b (horizontal) values. For the a values, we find the distance between the vertical points at the ends of each function.
-

If we divide g(x)'s vertical distance (4) by f(x)'s vertical distance (8), we get g(x)'s a value, which is  .
.
For the b values, we find the distance between the horizontal points at the ends of each function.

If we divide g(x)'s horizontal distance (8) by f(x)'s horizontal distance (2), we get g(x)'s b value, which is  .
.
The b value is read as opposite or inverse, so the actual b value is  .
.
Now back to our coordinates. We have to figure out the h and k values, which can be difficult because the graph has been stretched horizontally and vertically. But we can get these points by applying the a and b values to the coordinate points of f(x).
Note that these points will turn into our g(x) values and we can find our h and k values through them.
We can find our h and k values by subtracting the x and y values in g(x) from the the x and y values in the coordinates we just calculated.
Keep in mind that the h value is read as opposite.
Finally, we plug in our a, b, h, and k values to get our final equation.
Here's a different example of how to find an Inverse of a Relation.
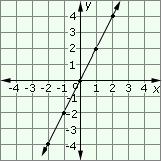
Graph the function =\frac{5}{3}x+2) and its inverse and determine the equation of
and its inverse and determine the equation of ) algebraically.
algebraically.
Before we graph it, we'll figure out how to find the inverse of a function.
First, you replace ) with
with  .
.
Secondly, you switch  and in the formula.
Thirdly, solve for .
Finally, replace with .
Now, we can graph both functions at once based on our knowledge of linear functions. Note that each function reflects off each other on the y=x line, and that each coordinate of the original function is flipped in the inverse function.

Let's look at one final example for the Inverse of a Function.
Given =-(x-2)^2) , graph the function and the inverse, and show how the domain of could be restricted so that is a function.
, graph the function and the inverse, and show how the domain of could be restricted so that is a function.
First, we graph the quadratic function and write down the points so we can find the inverse easier.

To find the inverse using the points, just switch the x and y values and graph it.

To restrict the domain, you have to keep only one side of the function as having the full function will not pass the Horizontal Line Test (each y value will have two x values).
So instead of: 
You can either have values less than the axis of symmetry (which is 2): 

Or you can have values more than the axis of symmetry: 

Aight, that's my blog. But you probably won't read it anyway
Subscribe to:
Posts (Atom)